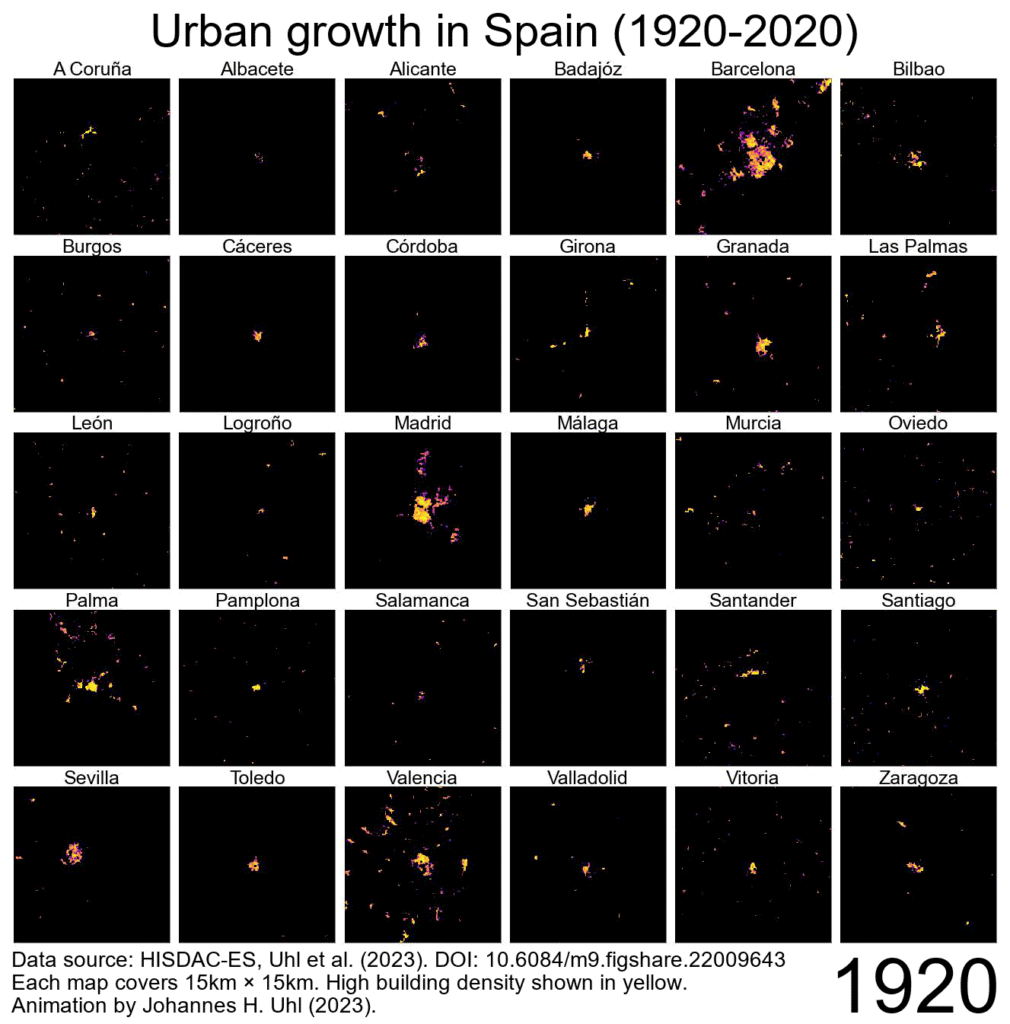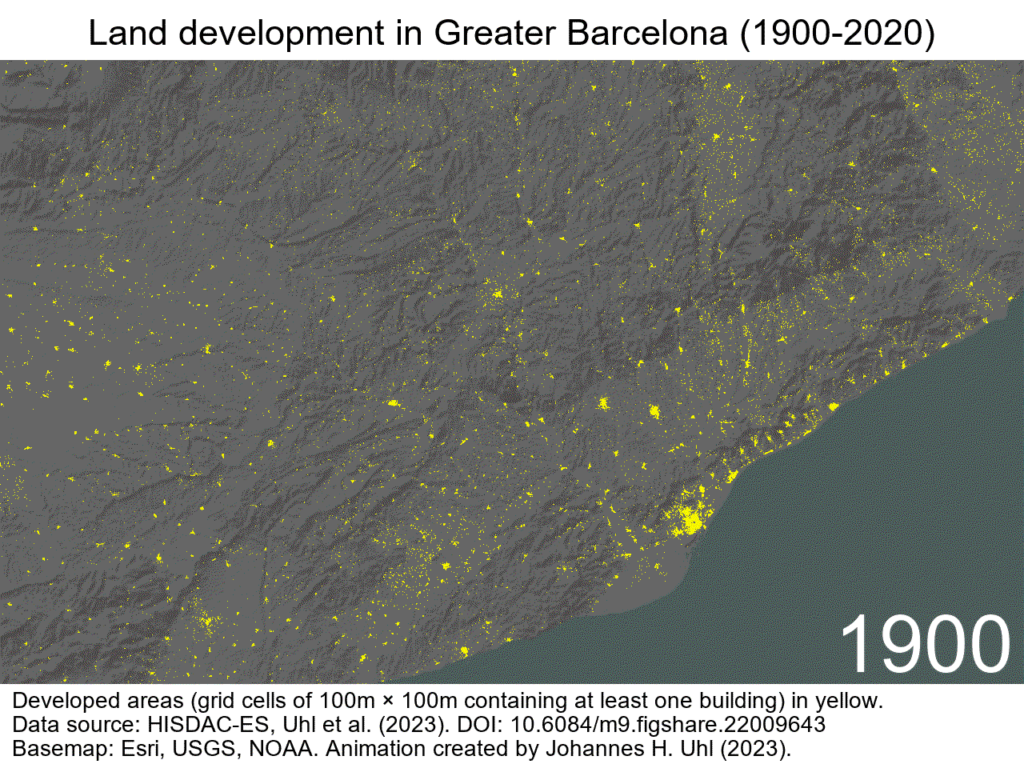
Cities, towns, villages, the buildings within their borders and the transportation infrastructure that connects them – these are elements of the “built environment,” the human-made conditions all around us. AI researchers are going the extra kilometer by creating a first-of-its-kind dataset that can help us understand the built environment by modeling how cities across a country have historically impacted the larger ecosystem, and even predict what they might look like in the future.
The built environment impacts social, environmental, economic, safety- and health-related aspects of life. For example, a park facilitates social interactions; walkable communities increase physical well-being; industrial centers affect the local economy.
Additionally, the built environment significantly affects the natural environment. Sustainable architecture and urban planning can minimize environmental impact by promoting energy efficiency, reducing pollution, and preserving natural habitats.
Because the built environment is so intertwined with human lives and society, it’s important to be able to analyze and study it. Today, data about the built environment is plentiful thanks to remote imaging and sensing. However, prior to the 1980s, this type of data was hard to find. So, when scientists learned of a large body of Spanish building data going back to 1900, they jumped at the chance to work with it.
Muchos Datos
A team of researchers, including computer scientist Keith Burghardt from USC Viterbi’s Information Sciences Institute (ISI) and researchers from the University of Santiago de Compostela and the University of Colorado Boulder, has recently published “HISDAC-ES: Historical Settlement Data Compilation for Spain (1900-2020),” which presents an accessible and publicly available dataset of Spanish cities derived from cadastral building data (i.e., official legal documentation concerning the dimensions, location, type, etc. of a building).
Burghardt said, “There was this large set of cadastral data on buildings from Spain that was distributed across different data repositories, and not accessible in a harmonized, aggregated manner – a total of 12 million building footprints.” These data became available in recent years, when, following an EU directive, several European countries released cadastral building data.
Burghardt gave examples of some of the information included with these 12 million building footprints: “The age of the building – when it was built? The type of building – is it a commercial building, residential building, etc.? The indoor area – how much space does this building take up? The number of building units – is this an apartment building or not and if so, how big? It was an enormous amount of interesting information about these buildings.”
The data was derived from old land records with varying degrees of detail and completeness. It came from a number of institutions or communities across Spain, all using different data models and data formats. Burghardt and the team acquired, processed, harmonized, aggregated, and evaluated the data. In short, Burghardt said, “We systematically integrated all these data and turned them into useful data for researchers.”
From Historic Settlements to a Sustainable Future
What can researchers do with HISDAC-ES? “Data like this allows us to, for example, figure out what Madrid looked like in 1930 before the Spanish Civil War, versus what Madrid looked like after the war. It allows us to understand the characteristics of cities,” said Burghardt. He continued, “It gives us a deep sense of historical trends. Even things like populations within Spain – we can use buildings to infer things like that. We can get a finer degree of population density than we can get from traditional census data.”
Burghardt also hopes this work can support urban science, furthering research about how cities scale with population, for example. He said, “There are some features of cities that we see vary with population. We could use these data to understand universal relations between the population of a city and infrastructure features, such as miles of road or acres of land, and how these patterns evolve in time, and even look at ways in which we could actually make better cities.”
Co-author Johannes Uhl of UC Boulder said, “These historical data allow us to learn from past trends to better infer on future expansion of cities, and on their populations, using not only classical statistical methods, but also by training AI models to simulate how cities might look 5, 50, 100 years from now.”
Other applications include exposure of the built environment to natural hazards. Bughardt said, “For example, to help us understand if cities growing into areas susceptible to climate change, such as areas vulnerable to sea level rise or wild fires. We can predict how cities might evolve in the coming decades, which can impact not just natural hazard risks but also deforestation and risks to wildlife.”
Data Visualized
Uhl helped process and visualize the data. He said, “The interesting thing is that such data allows us to reconstruct urban areas going around 100 years back in time, at high spatial detail, and to analyze the shape, size, and morphology of cities over long time periods.”
A similar dataset based on property data has previously been created and analyzed by the authors for the U.S. “After HISDAC-US, it was a logical next step to expand this idea to other countries, where similar input data is available,” said Uhl.
Like most historical datasets, HISDAC-ES is not free of limitations. Uhl said, “We look at historical development through the lens of the age of the contemporary building stock. That means, our data does not contain information on buildings that were torn down, or torn down and then rebuilt. As a consequence, we cannot measure shrinkage of cities, towns, and villages, only growth.” “However,” he continues, “shrinking cities are rare, and in many rural parts of Spain, not much of the building stock has been renewed during the last century.”
From the data, the researchers created visualizations that provide unprecedented insight in the evolution of Spanish cities.


What’s Next?
The authors plan to extend the research by utilizing AI techniques to fill in data gaps, possibly add new variables, and to broaden this research to other countries in Europe, such as France.
HISDAC-ES: Historical Settlement Data Compilation for Spain (1900-2020) has been published by Earth System Science Data (ESSD), an international, interdisciplinary journal for the publication of articles on original research datasets, furthering the reuse of high-quality data of benefit to Earth system sciences.
BY Julia Cohen