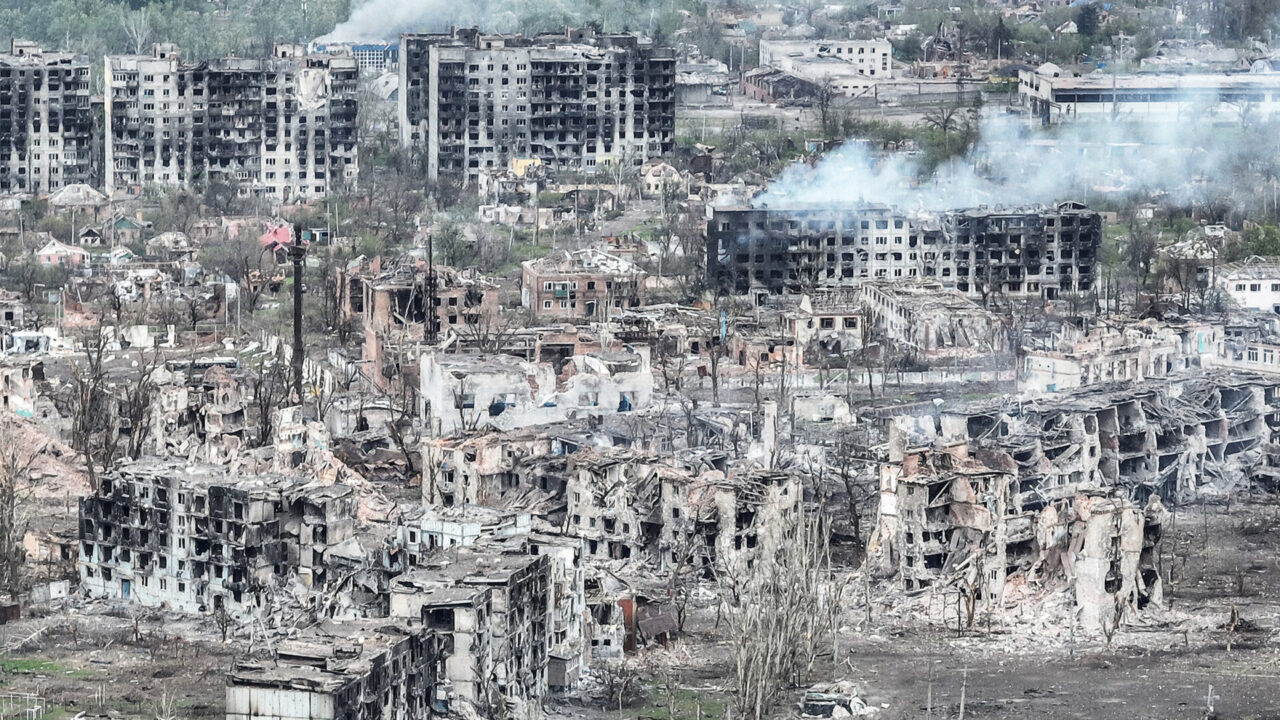
The city of Bakhmut is in ruins as a result of the Ukraine war. (Photo/Roman Playshko, Shutterstock)
Animated Maps Reveal Shocking Level of Devastation in Ukraine
Explore the devastating impact of the Russia-Ukraine War with animated maps from USC Dornsife earth scientist Sylvain Barbot.
Two years of war in Ukraine have caused widespread devastation to the country’s citizenry, infrastructure and environment, and new research utilizing publicly accessible satellite imagery lays bare the scope of destruction.
Utilizing open-source military intelligence data and satellite imagery, a research team including USC earth scientist Sylvain Barbot has visualized the effects to Ukraine since the beginning of the war on Feb. 24, 2022. Barbot noted the sheer amount of data being generated during the war allowed this depth of analysis at the city, regional and national level.
“It became obvious that we could get near-real-time information about the war thanks to social media, unlike with traditional media,” Barbot said. “A big revolution in this war is the evolving war of information. There has been an enormous community that’s formed online which is documenting the war in excruciating detail: artillery and troop movements, damage to civilian infrastructure, power grids and the movement of the front lines. They are helping counter the misinformation that combatants are spreading elsewhere.”
The study was published by Natural Hazards Research in January. Barbot, an associate professor of earth sciences at the USC Dornsife College of Letters, Arts and Sciences, co-wrote the manuscript with Teng Wang and Hang Xu, both of Peking University.
Ukraine War: ‘Like cancer spreading’
The team tracked three battles — Rubizhne, Severodonetsk and Lysychansk — from March to July 2022, and the one-year Battle of Bakhmut, which began in May 2022. Utilizing data from the Sentinel-1 satellite, the team followed the destruction of those cities and how tactics evolved as the conflict advanced.
The synthetic aperture radar (SAR) satellite data — which can be used to monitor natural disasters when access is impossible — gave researchers a view of the ground, allowing them to see how quickly a city could be destroyed.
“Different from optical sensors, SAR transmits electromagnetic waves and records the signal reflected back from Earth, regardless of sunlight and clouds. The reflected waves can be used to evaluate damage during natural disasters and war alike,” Wang said.
For example, Bakhmut — a 450-year-old city with a population of 71,000 — was completely wiped out after a year of Russian offensives. Time-lapse video of the satellite images created by the research team shows how rapidly destruction spread within the city under siege.
“After Hang processed the images and we saw the end result, it looked like a checkerboard or mesh,” Barbot said. “We asked, ‘Why is that?’ and we realized that it’s only the roads that survived. Everything else was collapsed, destroyed, evaporated, and the entire city is completely flattened.”
Tracking the conflict with the SAR imaging data also revealed other forms of open-source intelligence data weren’t always reliable. Satellite data showed fighting in Lysychansk starting in June 2022, while other forms of intelligence data said the Russian army was not advancing on the city at the time.
“You can see a neighborhood going away, and then another and then there’s no progress because of a natural obstacle like a river,” Barbot said. “After they’ve bombarded enough stuff, the front line begins to move to the west and the Russian army advances through the crumbles. Eventually the story repeats itself and after a year, there’s just nothing left. It looks like cancer spreading throughout the body.”
Ukraine devastation: Infrastructure destroyed
The collapse of the Kakhovka Dam nearly set off a nuclear disaster in June 2023. After it was breached by an explosion set off by a retreating Russian army in November 2022, the dam — which holds back the Dnipro River — was partially destroyed months later, flooding nearby towns and draining the nearby reservoir.
Buildings and systems above the dam on the Dnipro were drying up. At risk was the reservoir dedicated to the nearby Zaporizhzhia Nuclear Power Plant’s cooling tank. A nuclear disaster could have doomed the region if the plant’s cooling pond fell below necessary values. Luckily, it didn’t.
“When the collapse happened, we were scared that it would provoke another Chernobyl nuclear accident in Ukraine. So we quickly looked at the data to check the extent of the drainage upstream. We were relieved to see the Zaporizhzhia cooling pond at full water level,” Barbot said.
The team used data from the Sentinel-2 and Landsat satellites to examine the damage to the dam and to the surrounding area. The high-definition landscape pictures show the dam complete, and then cut in half, destroyed by the evacuating Russian forces. They also show extensive flooding in villages like Oleshky, Kardashinka and Gola Prystan along the Dnipro flood plain.
Lights out amid Ukraine devastation
To investigate how the conflict affected everyday life for Ukrainians, the researchers used night light images collected by the Suomi satellite. The sensor on Suomi is sensitive to artificial light, which the researchers used to show changes in human activity over time.
The team then compared images showing the monthly average night light in Eastern Europe, beginning in February 2022 when the war began. In cities and countries surrounding Ukraine, the average monthly night light remained stable.
However, many cities in Ukraine are invisible in the same period. In major cities like Kyiv, Cherkasy and Lviv, night light is greatly reduced. In the villages and cities under heaviest bombardment in Eastern Ukraine, like Mykolaiv, Kharkiv and Dnipro, the map is nearly black.
“There are famous images of Earth from space where you can see of clusters of city lights that have this bustling human activity,” Barbot said. “We looked at all of Eastern Europe and you can see those lights you’re familiar with, except an entire country is completely black — all of Ukraine was dark. You could see from space an entire country shutting down.”
The researchers note that these same methodologies can be applied by anyone — with the technical knowledge to analyze the data — to any conflict. They said these approaches offer “access to high-resolution, unbiased information, enhancing our ability to grasp the true impact of war on the ground.”
“It’s a human disaster — we have free, publicly available data to document the atrocities to civilians and the loss of livelihood for millions,” Barbot said. “I wish there weren’t other opportunities to use these techniques — it’s a wonderful application of the technology, but it’s devastating that we can use them around such tragic events.”
Research for this study was funded by the National Science Foundation (EAR-1848192).